When your multi-protocol bridge starts adding seconds of delay
When your multi-protocol bridge starts adding seconds of delay
You deploy a bridge to unify Modbus, BACnet, and MQTT, expecting smooth data flow. Then you find alarm states lagging or control loops drifting out of sync. The problem usually isn't the bridge itself, but how its latency scales under real production loads—a limit you often only discover after go-live.
What latency scaling actually means for a protocol bridge
In practice, latency scaling isn't about a single slow message. It's the cumulative delay that piles up as connection counts, polling rates, and payload sizes all increase together. A bridge might add 10ms per transaction in a lab test. But under load, transaction queues form, serialization overhead spikes, and context switching between protocol stacks eats CPU cycles. That's when tail latency—the worst-case delay—can balloon by orders of magnitude. This is where the theoretical throughput meets the messy reality of your server's I/O scheduler and network stack.
The real bottleneck isn't the network—it's state management
Engineers often assume bandwidth is the limit. In my experience, the dominant source of scaling latency is usually the bridge's internal state management. Each connected device or client session maintains state: connection handles, security contexts, transaction IDs, data buffers. As sessions scale, cache misses increase, memory allocation gets fragmented, and garbage collection in managed runtimes can introduce multi-second pauses. I've seen bridges on Java or .NET runtimes freeze for 2-3 seconds under moderate load during a full GC, dropping real-time telemetry entirely. It's a detail that's rarely in the datasheet.
Assuming linear scaling leads to system failure
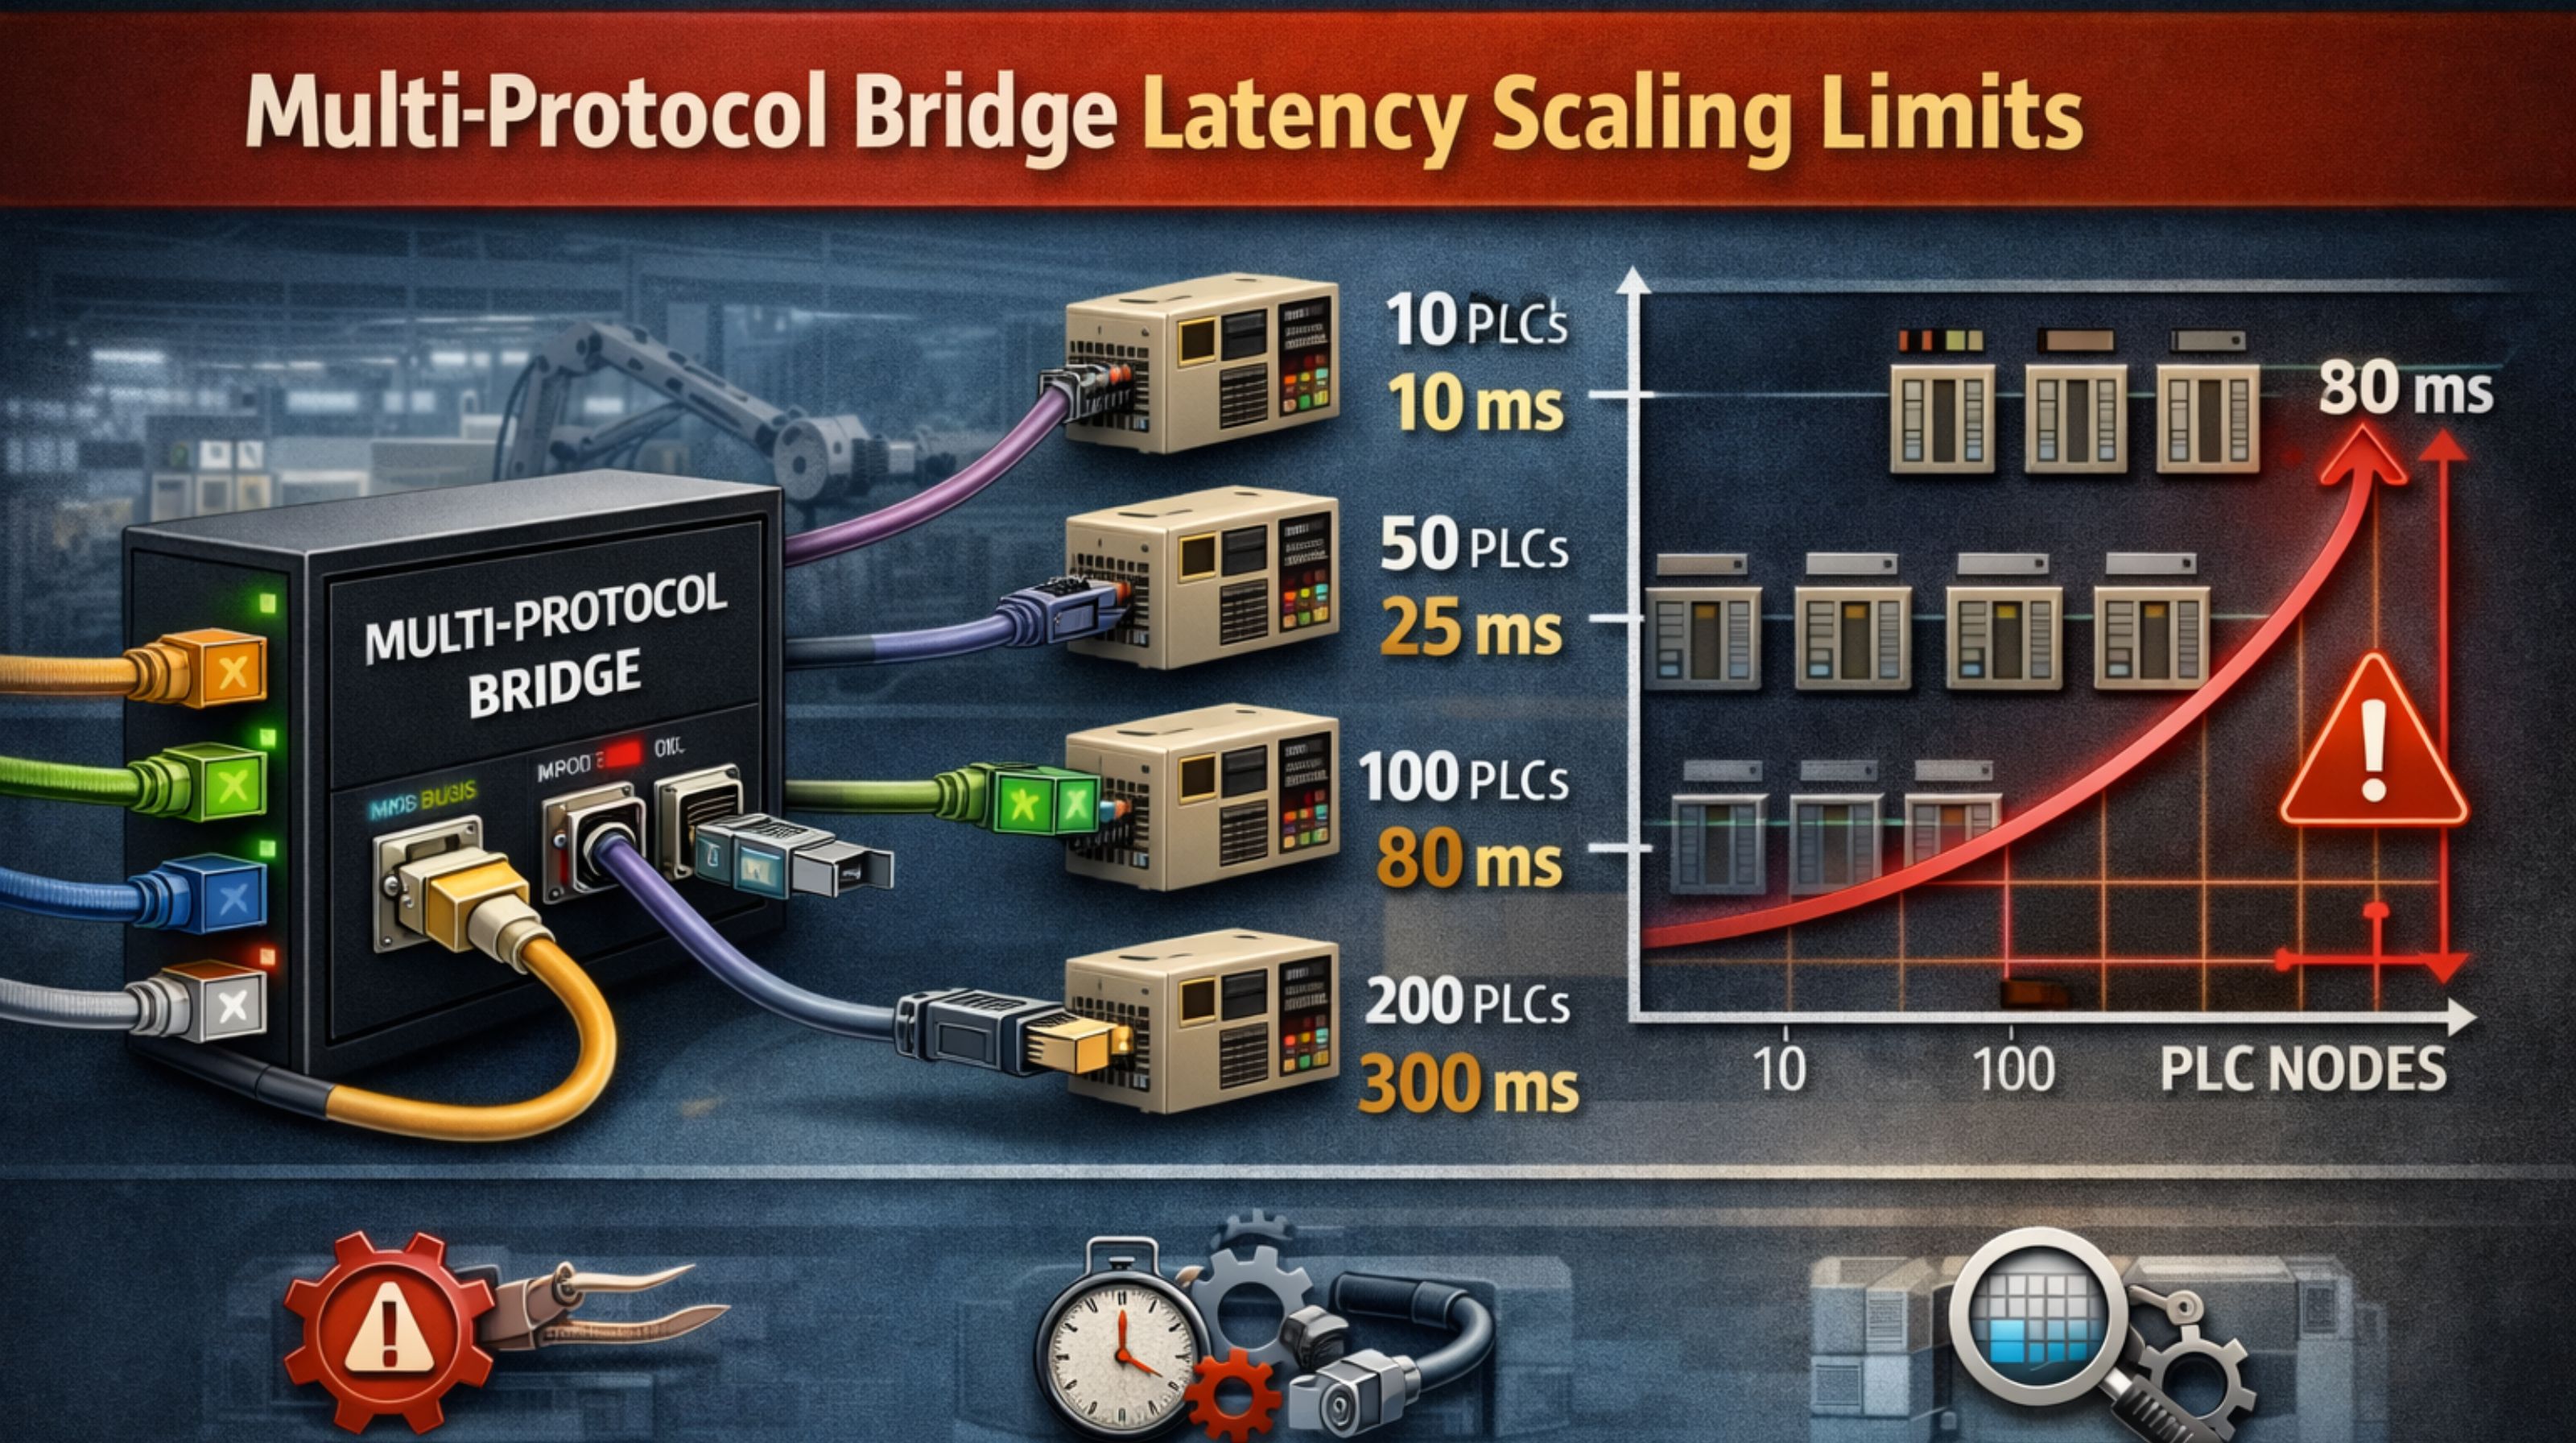
The most common mistake is extrapolating performance linearly from a small pilot. If a bridge handles 100 devices with 50ms latency, it's tempting to assume 1000 devices will yield 500ms. In reality, latency often scales exponentially after a certain concurrency threshold, thanks to lock contention in shared code paths. A bridge translating between a stateful protocol like OPC UA and a stateless one like MQTT might use a global lock for session mapping, causing all threads to queue. The failure manifests not as an error, but as increasingly stale data. That makes diagnosis difficult and erodes trust in the entire data pipeline.
Deciding if your bridge can handle next year's load
To decide, you have to test under your expected peak concurrency with your specific protocol mix and message patterns. Don't rely on vendor benchmarks. Instrument the bridge to measure not just average latency, but the 95th and 99th percentiles. If latency variance—the jitter—exceeds your tolerance for control or monitoring, the architecture is at risk. For deterministic systems, you might consider a hardened engine node designed for predictable performance under load, rather than a general-purpose software bridge. The decision often comes down to whether you can tolerate occasional multi-second delays in your critical data flows.
FAQ
What is a typical latency for a multi-protocol bridge?
Under light load, you might see 10-100 milliseconds per hop. But honestly, that number is pretty meaningless without defining concurrency and message size. The spec sheet value is almost always a best-case, single-stream measurement.
Why does latency increase over time in a running bridge?
Memory fragmentation, connection table saturation, and gradual buffer bloat in TCP stacks cause what I call "creeping latency." A bridge that runs for weeks without a restart can see its baseline delay increase by 30-40% because of these operational leaks.
Can adding more CPU cores reduce bridge latency?
Only if the bridge software is truly parallelized. A lot of legacy bridges use single-threaded pollers or have a central dispatcher that becomes the bottleneck. Throwing hardware at a poorly concurrent architecture gives you minimal gains, and can even increase latency due to cross-core synchronization costs.
How do I measure latency scaling before production deployment?
Use a load tester that simulates your exact device profiles and traffic patterns, not just raw message blasts. Measure p95 and p99 latency over sustained periods. If you're integrating industrial systems, a protocol health audit can identify scaling risks in your specific context before they cause downtime.