Centralized Dashboard for Mixed IoT Protocols
Centralized Dashboard for Mixed IoT Protocols
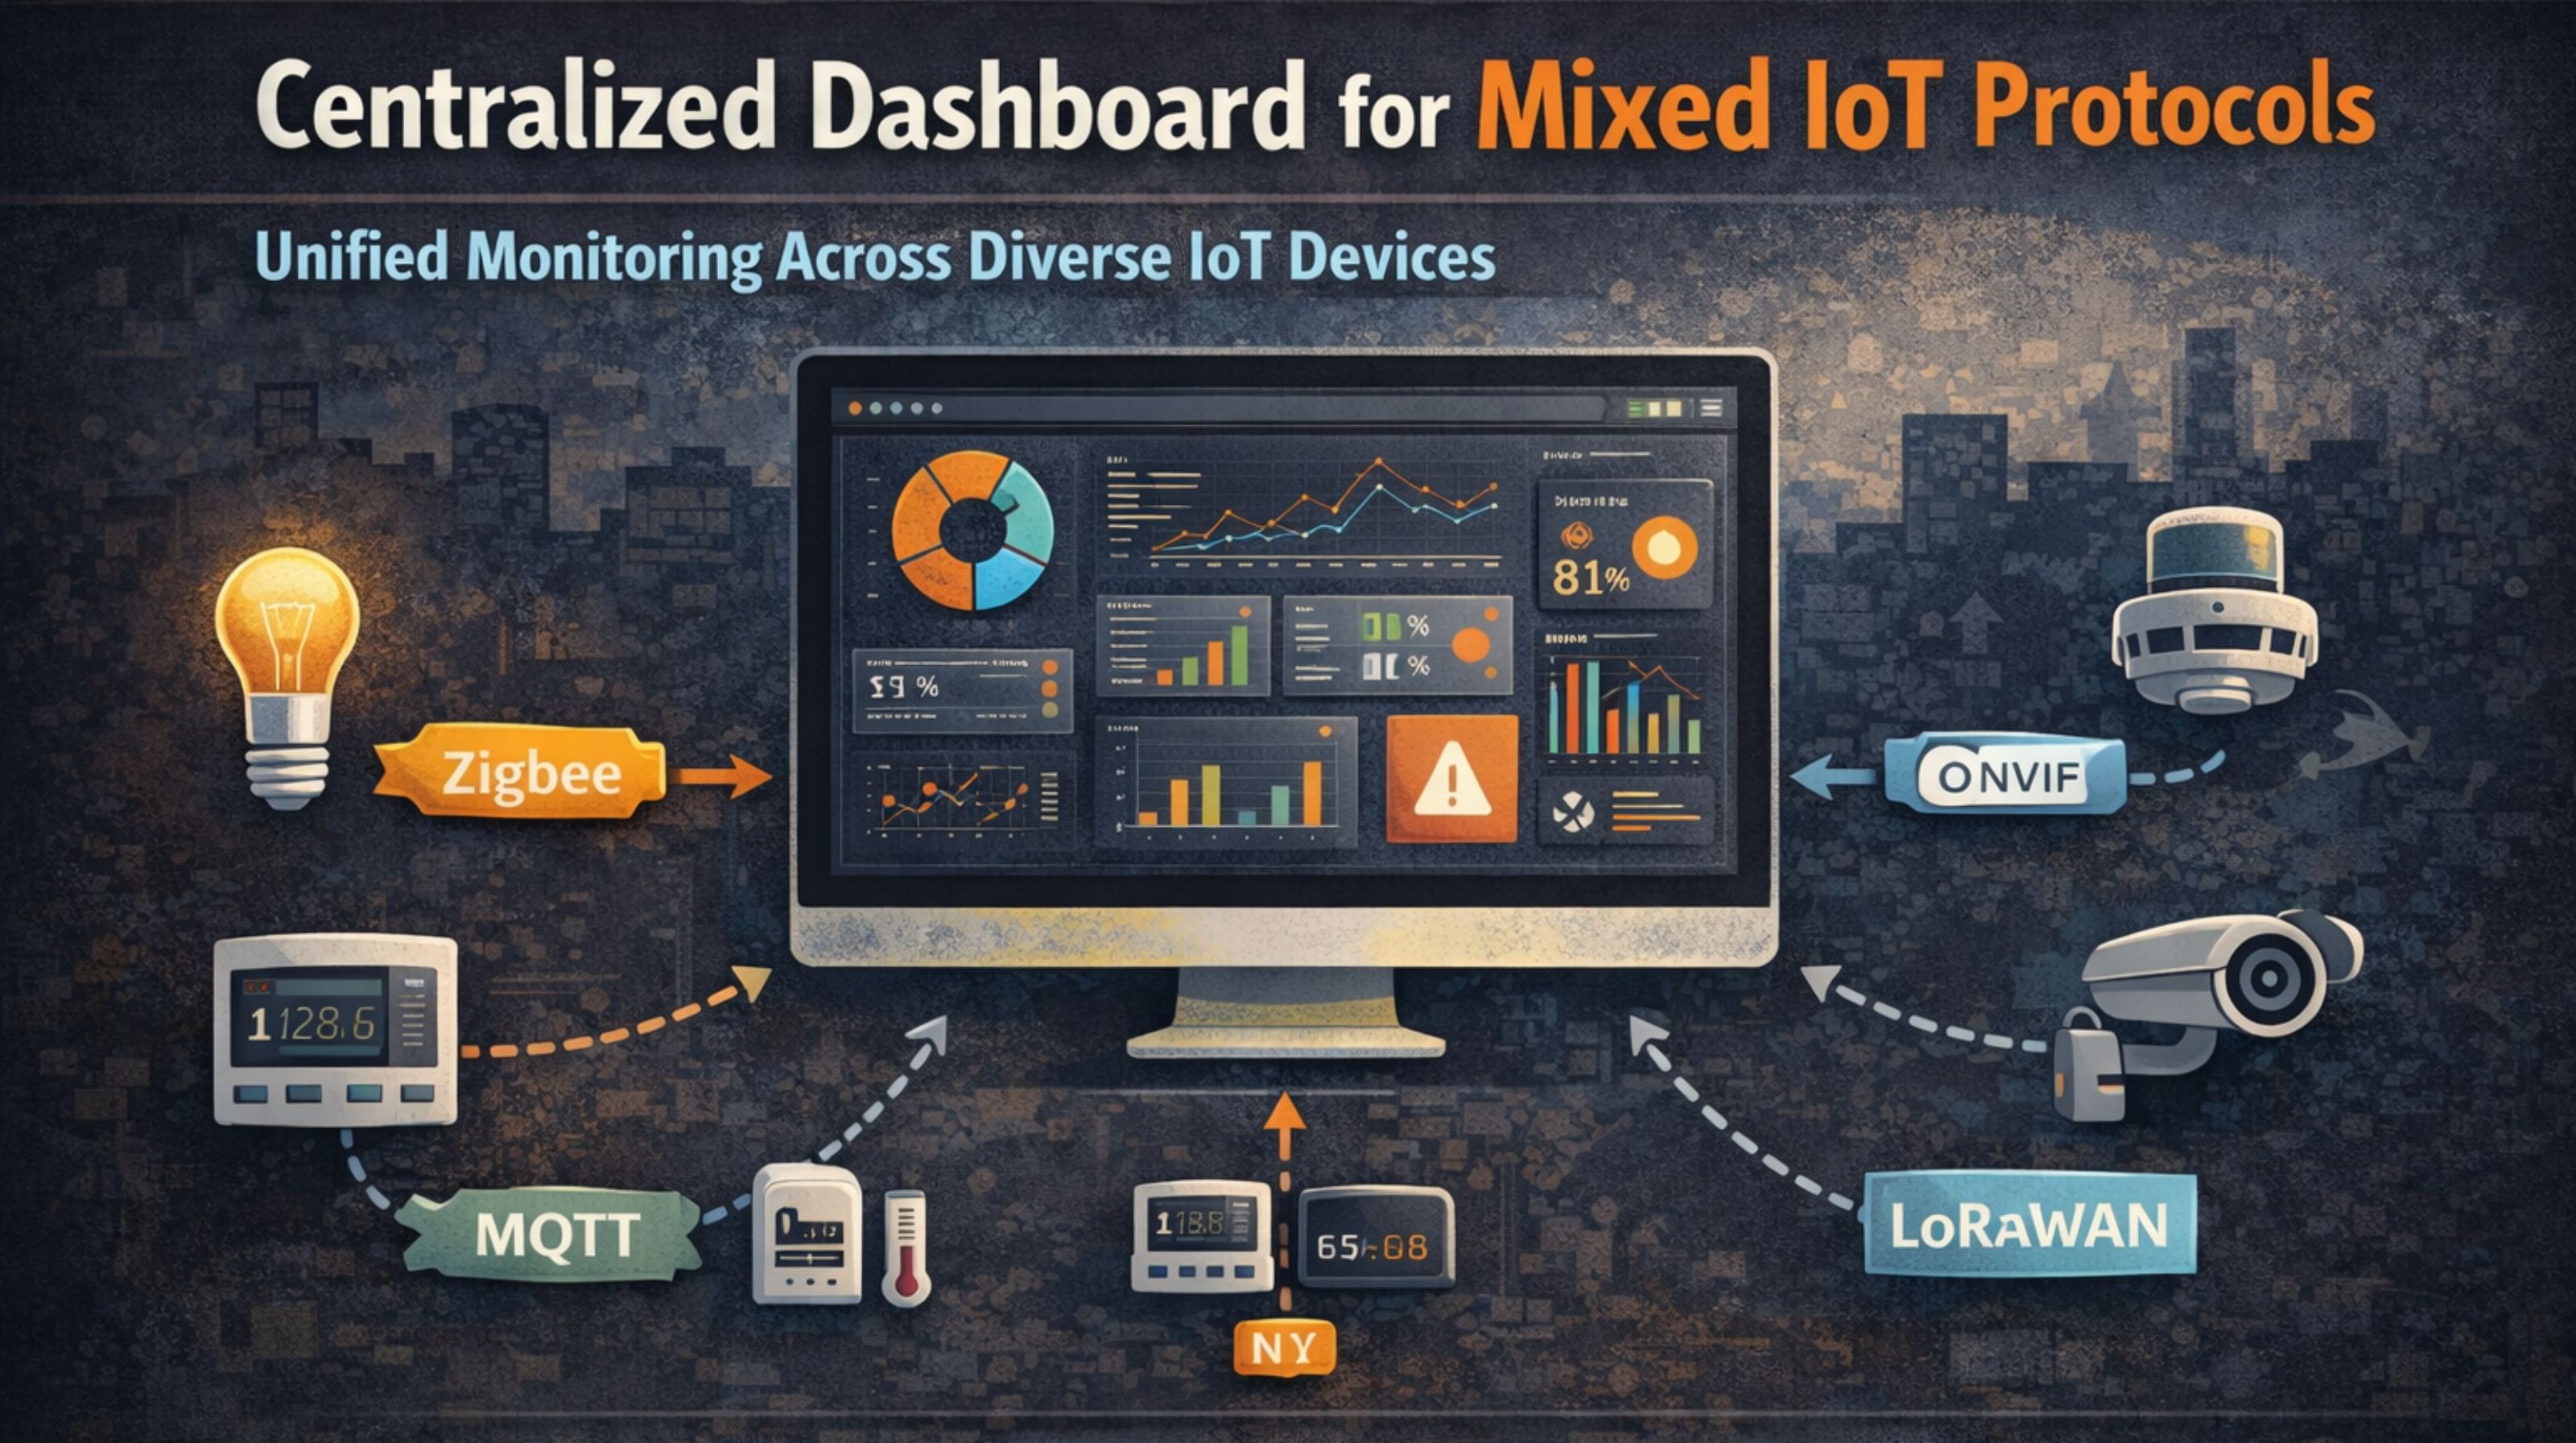
If you're managing a bunch of different IoT devices, a centralized dashboard for mixed protocols gives you that single pane of glass you've been looking for. It basically pulls data from all sorts of communication standards into one unified interface, so you're not jumping between five different apps.
Core Architecture and Design
At its heart, the architecture uses protocol adapters or a middleware layer to make all the data play nice together. This layer does the heavy lifting of translating messages from things like Zigbee, Z-Wave, MQTT, and LoRaWAN into a common data model that the dashboard can actually understand.
Essential Dashboard Features
You'll want a few key features. Real-time device status is a must-have, along with alerting that works across different protocols. Unified data visualization is what makes it all click. Don't forget role-based access control and batch device provisioning—they're what let you scale up without losing your mind.
Protocol Integration Challenges
It's not all smooth sailing, of course. The big headaches usually come from juggling different security models, weird data formats, and clashing update mechanisms. A good dashboard has to abstract away these complexities so you get consistent management without having to be an expert in every single protocol.
Implementation and Deployment Strategy
My advice? Start small. Run a pilot that integrates just the two most dominant protocols in your current setup. And build your protocol connectors as containerized microservices—it makes the whole dashboard system way more scalable and a lot easier to maintain down the line.
FAQ
What is a centralized IoT protocol dashboard?
It's a single software interface that lets you manage and monitor IoT devices, even if they're all using different communication protocols, from one central spot.
Which protocols can such a dashboard support?
Most of the common ones: MQTT, CoAP, Zigbee, Z-Wave, LoRaWAN, and HTTP/REST. It usually does this through modular connectors you can swap in and out.
What is the biggest technical hurdle in building one?
Hands down, it's creating a solid normalization layer. You need something that can reliably translate all those disparate data formats and security schemes into one unified model without breaking.
Can I use open-source tools to build this dashboard?
Absolutely. Platforms like Node-RED, Grafana, and Home Assistant are great starting points. Just be ready for some significant customization, especially if you're dealing with mixed enterprise-grade protocols.
How does the dashboard handle device provisioning?
The more advanced ones use templates and automated workflows. The idea is to hide all the protocol-specific steps from the administrator, making the whole process much simpler.
Is real-time monitoring possible across all protocols?
You can get real-time monitoring, but it depends on the protocol's own latency. A good dashboard will manage these differences and actually show you when there might be a delay.
How important is security in a multi-protocol dashboard?
It's critical. The dashboard becomes a central point of control, so it has to enforce consistent, strong security policies across every single protocol you plug into it.
What are the benefits for business operations?
You'll cut down on operational overhead, troubleshoot problems faster, get consolidated analytics, and find it much simpler to scale your entire IoT deployment.